Asciidoctor Diagram を使用して AsciiDoc 形式のドキュメントに PlantUML の図を埋め込む
Translate to English
https://translate.google.com/translate?sl=auto&tl=en&u=https%3A%2F%2Fksby.hatenablog.com%2Fentry%2F2021%2F01%2F24%2F094643
概要
記事一覧はこちらです。
Asciidoctor Diagram を使用することで AsciiDoc 形式のドキュメントに PlantUML の図を埋め込めるようなので試してみます。
参照したサイト・書籍
Asciidoctor Diagram
https://asciidoctor.org/docs/asciidoctor-diagram/asciidoctor / asciidoctor-diagram
https://github.com/asciidoctor/asciidoctor-diagramPlantUML 概要
https://plantuml.com/ja/Graphviz - Graph Visualization Software
https://graphviz.org/
目次
- build.gradle に Asciidoctor Diagram の設定を追加する
- src/docs/asciidoc/03_diagram ディレクトリを作成する
- index.adoc を作成し PlantUML の diagram を記述する
- asdiidoctor タスクを実行して PlantUML の図が表示されることを確認する
- Asciidoctor Diagram の 2.1.0 では Graphviz をインストールしていなくても画像ファイルが生成できるようになった模様
- PlantUML integration Plugin をインストールし、PlantUML のコードを拡張子 .puml の別ファイルに分ける
手順
build.gradle に Asciidoctor Diagram の設定を追加する
Using AsciidoctorJ Diagram を参考に build.gradle を以下のように変更します。
..........

asciidoctorj {
    modules {
        diagram.use()
        diagram.version "2.1.0"
    }
    attributes "source-highlighter" : "rouge"
}
- asciidoctorj block に
modules { ... }を追加します。Asciidoctor Diagram の最新バージョンは https://github.com/asciidoctor/asciidoctor-diagram で確認しました。
src/docs/asciidoc/03_diagram ディレクトリを作成する
src/docs/asciidoc の下に 03_diagram ディレクトリを作成します。
index.adoc を作成し PlantUML の diagram を記述する
src/docs/asciidoc/03_diagram の下に index.adoc を新規作成し、以下の内容を記述します。PlantUML のコードは https://plantuml.com/ja/ に掲載されていたものをコピーしました。
[plantuml, ...]を記述してから....~.....の間に PlantUML のコードを記述します。[plantuml, ...]の2番目のパラメータに生成する画像ファイル名、3番目のパラメータに生成する画像のタイプを記述します。- 各 diagram 毎の生成可能な画像のタイプは Creating a Diagram に記載されています。plantuml は png, svg, txt がサポートされていました。今回は svg を指定します。
= AsciiDoc 形式のドキュメントに PlantUML の図を埋め込む
Doc Writer <doc@example.com>
:lang: ja

== シーケンス図

[plantuml,example-sequence,svg]
....
@startuml
Alice -> Bob: Authentication Request

alt successful case

    Bob -> Alice: Authentication Accepted

else some kind of failure

    Bob -> Alice: Authentication Failure
    group My own label
    Alice -> Log : Log attack start
        loop 1000 times
            Alice -> Bob: DNS Attack
        end
    Alice -> Log : Log attack end
    end

else Another type of failure

   Bob -> Alice: Please repeat

end
@enduml
....

== クラス図

[plantuml,example-class,svg]
....
@startuml

abstract class AbstractList
abstract AbstractCollection
interface List
interface Collection

List <|-- AbstractList
Collection <|-- AbstractCollection

Collection <|- List
AbstractCollection <|- AbstractList
AbstractList <|-- ArrayList

class ArrayList {
  Object[] elementData
  size()
}

enum TimeUnit {
  DAYS
  HOURS
  MINUTES
}

annotation SuppressWarnings

@enduml
....
AsciiDoc Plugin の preview を見ると PlantUML の図が表示されません。エディタ上部に To be able to show diagrams in the preview, download asciidoctorj-diagram or enable Kroki in the settings. というメッセージが表示されていますので Yes, download now! をクリックします。

asciidoctorj-diagram の jar ファイルがダウンロードされて、今度は preview に PlantUML の図が表示されるようになりました。

ただし asciidoctorj-diagram の jar ファイルが 2.1.0 でないようで、クラス図の方は図が表示されませんでした。
asdiidoctor タスクを実行する
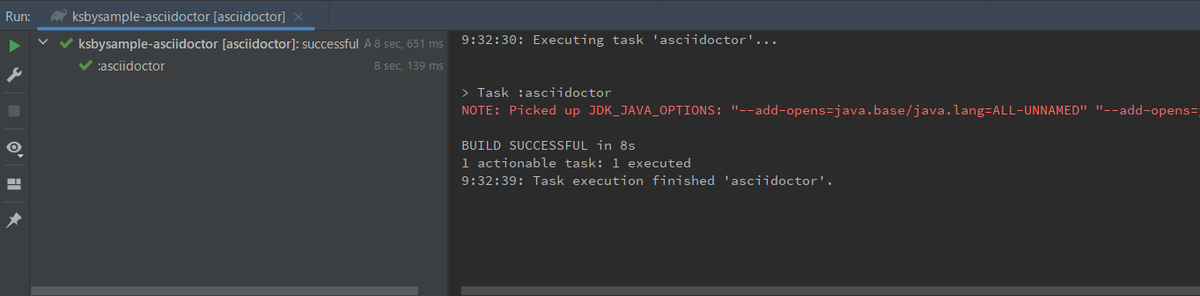
asciidoctor タスクを実行すると BUILD SUCCESSFUL が出力されました。

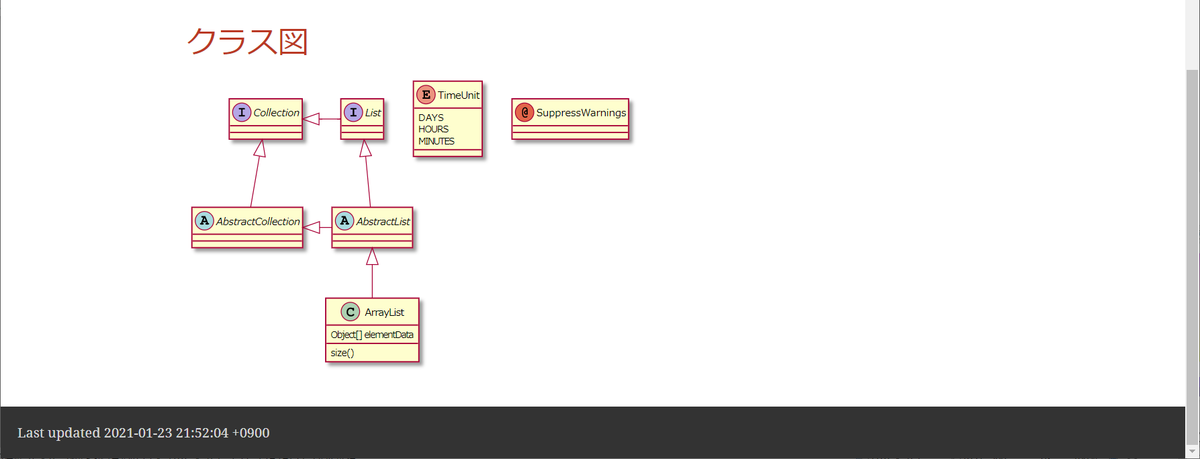
build/docs/asciidoc/03_diagram の下に index.html と画像ファイルが出力されており、

index.html をブラウザで開くと PlantUML の図が表示されました。

Asciidoctor Diagram の 2.1.0 では Graphviz をインストールしていなくても画像ファイルが生成できるようになった模様
build.gradle の diagram.version を 2.0.5 にしてから clean タスク実行 → asciidoctor タスク実行を行うと、
.........

asciidoctorj {
    modules {
        diagram.use()
        diagram.version "2.0.5"
    }
    attributes "source-highlighter" : "rouge"
}
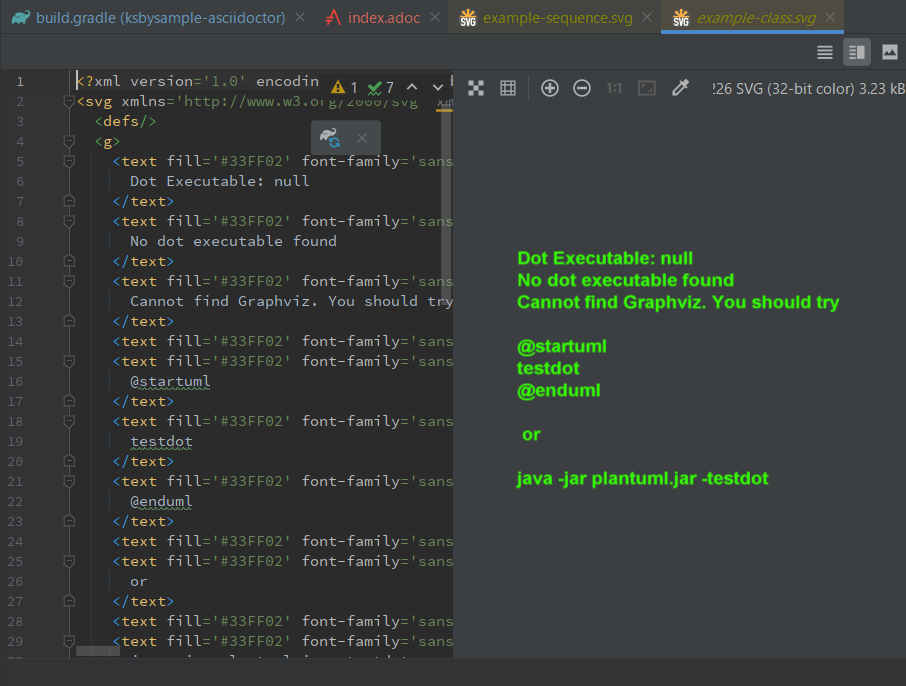
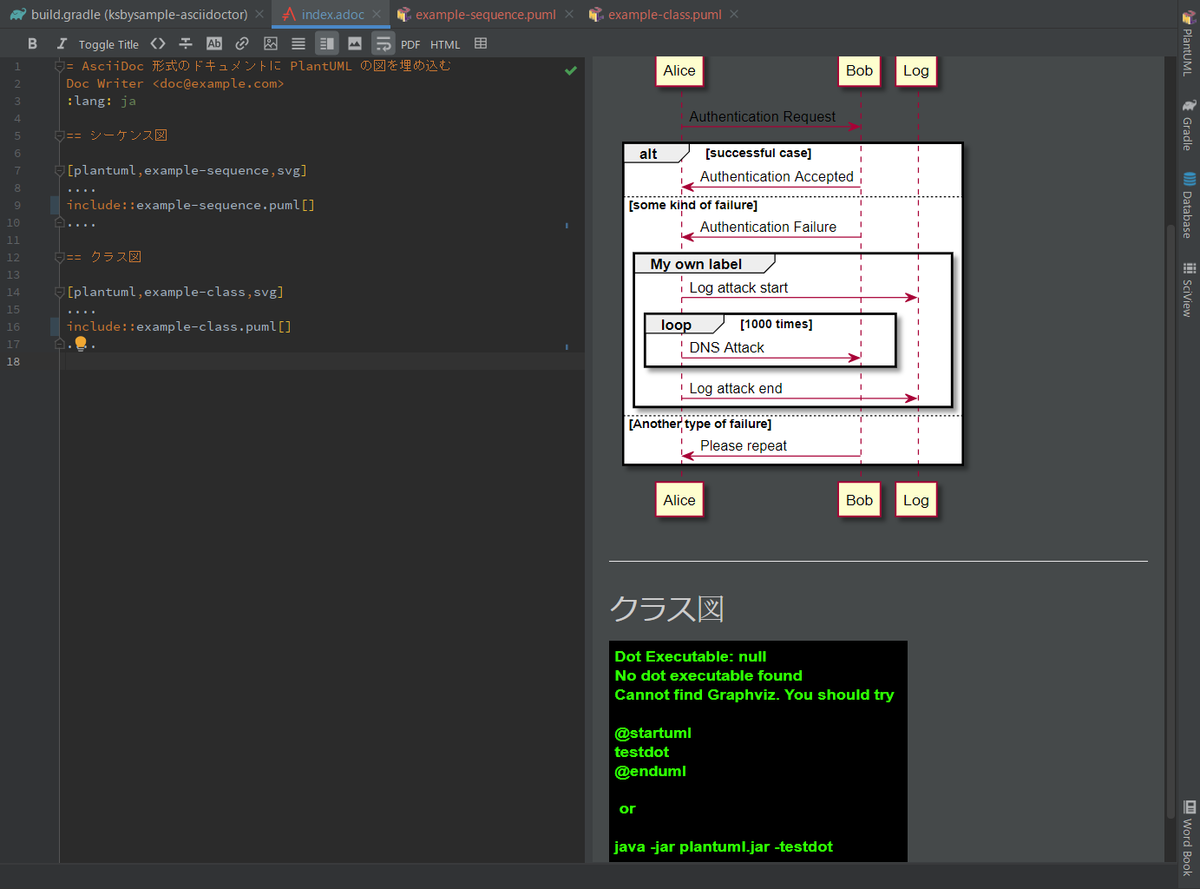
build/docs/asciidoc/03_diagram/example-sequence.svg は図が表示されますが、

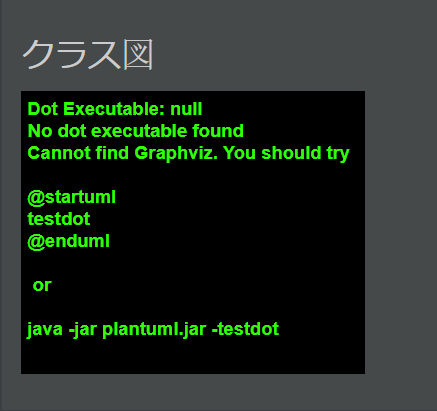
build/docs/asciidoc/03_diagram/example-class.svg は Dot Executable: null No dot executable found Cannot find Graphviz. のメッセージが表示されて図が生成されません。
このメッセージが表示された場合、Graphviz - Graph Visualization Software から Windows のインストーラーをダウンロードしてインストールすれば図が生成されるのですが、diagram.version を 2.1.0 にすると Graphviz がインストールされていなくてもどちらの図も生成されるようになりました。
PlantUML integration Plugin をインストールし、PlantUML のコードを拡張子 .puml の別ファイルに分ける
AsciiDoc Plugin の preview ではクラス図の方が表示されませんでしたが、IntelliJ IDEA には PlantUML integration Plugin があり、PlantUML のコードを拡張子 .puml のファイルに分けると PlantUML integration Plugin の画面に表示させることができます。PlantUML integration Plugin をインストールしてコードを別ファイルに分けてみます。
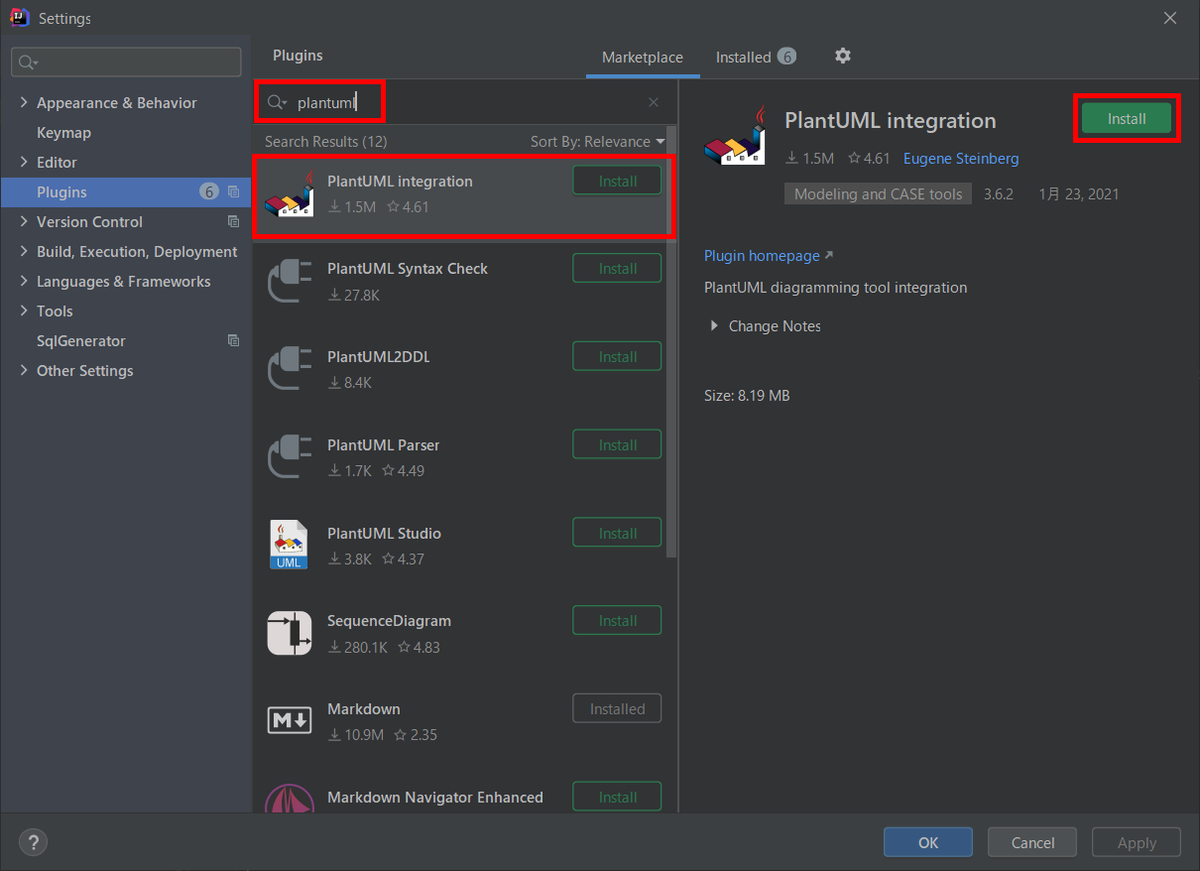
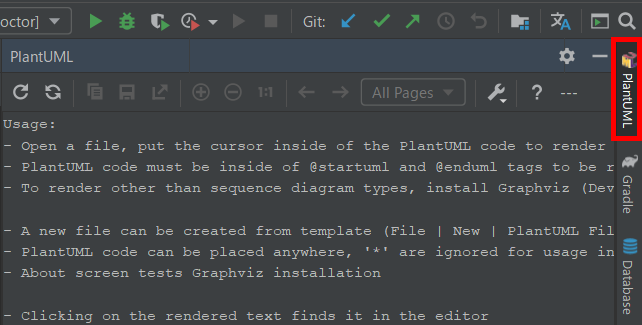
IntelliJ IDEA で「Settings」ダイアログを開き、plantuml で検索して PlantUML integration Plugin をインストールします。
インストールすると IntelliJ IDEA の画面右側に「PlantUML」が表示されます。
src/docs/asciidoc/03_diagram の下に example-sequence.puml を新規作成し、index.adoc の [plantuml,example-sequence,svg] .... ~ .... の中のコードをこのファイルに移動します。生成されたシーケンス図が PlantUML integration Plugin の画面に表示されます。

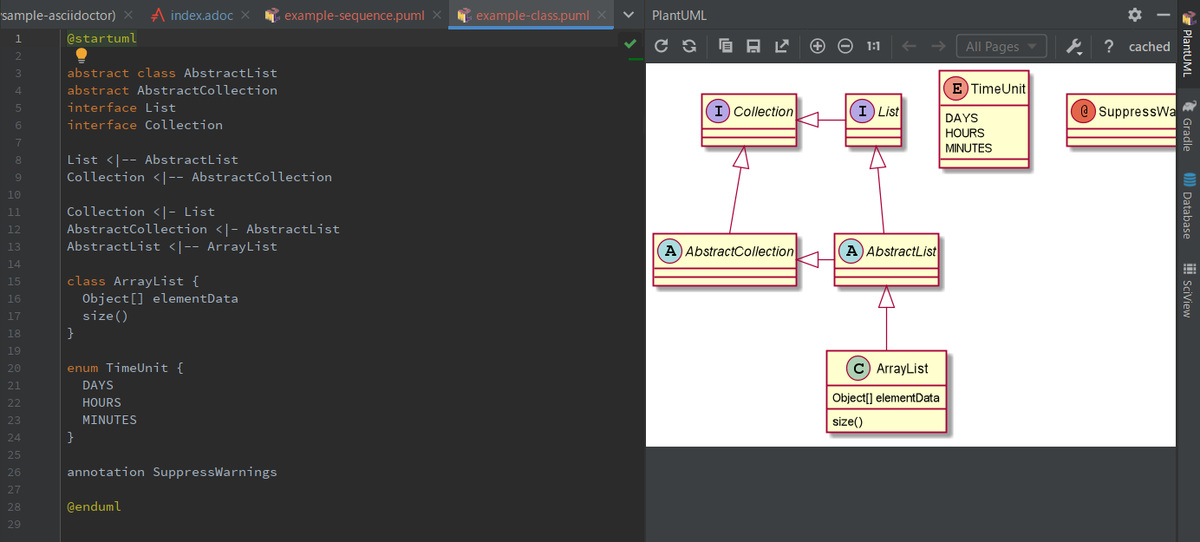
src/docs/asciidoc/03_diagram の下に example-class.puml を新規作成し、index.adoc の [plantuml,example-class,svg] .... ~ .... の中のコードをこのファイルに移動します。生成されたクラス図が PlantUML integration Plugin の画面に表示されます。
index.adoc では example-sequence.puml、example-class.puml を include するよう変更します。
= AsciiDoc 形式のドキュメントに PlantUML の図を埋め込む
Doc Writer <doc@example.com>
:lang: ja

== シーケンス図

[plantuml,example-sequence,svg]
....
include::example-sequence.puml[]
....

== クラス図

[plantuml,example-class,svg]
....
include::example-class.puml[]
....
include directive で別ファイルを取り込んでも AsciiDoc Plugin の preview に PlantUML の図が表示されます。
clean タスク実行 → asciidoctor タスク実行をすると BUILD SUCCESSFUL が表示されて、
build/docs/asciidoc/03_diagram の下にファイル分割前と同じように index.html 等が生成されており(拡張子 .puml のアイコンが PlantUML integration Plugin と同じアイコンになっています)、

index.html をブラウザで開くと PlantUML の図が表示されました。

履歴
2021/01/24
初版発行。